• Home
  • Information
    • Ways to get involved
    • About behavior analysis
  • People
    • Liz Kyonka >
      • Classes
      • Contact
    • Research Assistants
  • Research
    • Technology Use
    • Metascience
    • Gambling
    • Timing
    • Posters
QAB LABORATORY
  • Home
  • Information
    • Ways to get involved
    • About behavior analysis
  • People
    • Liz Kyonka >
      • Classes
      • Contact
    • Research Assistants
  • Research
    • Technology Use
    • Metascience
    • Gambling
    • Timing
    • Posters

How do behavior analysts report quantitative information?

Picture
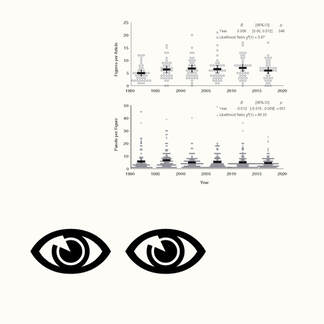
In Beyond inference by eye: Statistical and graphing practices in JEAB, 1992-2017, we evaluated how behavior analysts use inferential statistics and graph data when publishing in the Journal of the Experimental Analysis of Behavior (JEAB; Kyonka, Mitchell & Bizo, 2019). JEAB authors are increasingly likely to report confidence intervals and p values. There is more variation in types of graphs published in JEAB today than in the previous century, and the proportion of JEAB graphs that represent variability graphically (e.g., with error bars) is also increasing.

Scientific Behavior
Picture

QAB Laboratory

© COPYRIGHT 2024. ALL RIGHTS RESERVED.
  • Home
  • Information
    • Ways to get involved
    • About behavior analysis
  • People
    • Liz Kyonka >
      • Classes
      • Contact
    • Research Assistants
  • Research
    • Technology Use
    • Metascience
    • Gambling
    • Timing
    • Posters